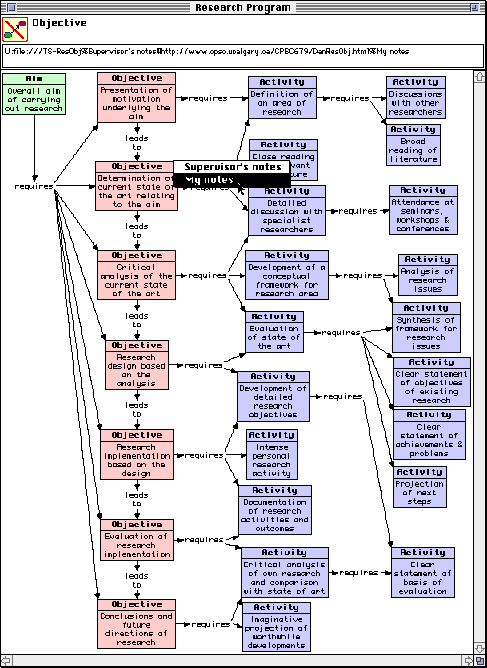
Computer support of concept maps makes it simple to enhance their visual appearance through precise drawing and consistent use of color. It also allows the map to be used as an active computer interface providing links to, and control of, other materials. For example, Figure 3 shows an application in graduate education where students are introduced to the structure of a research program through an interactive concept map that may be edited and linked to their own research (Gaines and Shaw, 1993c). The node types and content may be edited by the students, as may a database of information attached to the nodes that provides links to other concept maps and files, either locally or across the Internet. In Figure 3, the student has moused over a node on objectives concerned with the determination of the current state of the art, and moused down when the cursor changed to a popup menu icon to access a menu giving access to a local file of her supervisor's notes and a web file of her own notes put up as part of a course.

Figure 3 Concept map on carrying out graduate research (after Gaines and Shaw, 1993b)
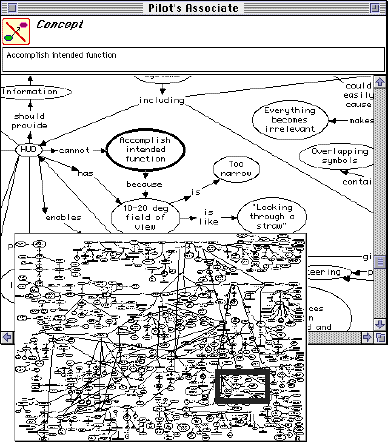
Computer support also makes it possible to manage very large concept maps that are difficult to manage in paper form. The upper window of Figure 4 shows part of a map with some 900 nodes that was originally developed on large white boards from US Air Force pilots as part of the knowledge acquisition process for the design of the pilot's associate expert system (McNeese et al., 1990). It took 6 person-hours to enter this entire map from the printouts in the report cited. An auxiliary helper window at the bottom shows the whole map in miniature with a rectangle at the lower right scrolling with the upper window to indicate the location in the total map of the part being viewed and edited. A "fit-to-screen" command may be used to display the entire map in the editing window also so that large parts of it may be moved or copied and pasted in one operation. In general, such large maps are usually partitioned into small modules that are linked through hypermedia links such as those as illustrated in Figure 3. However, if required, large maps are readily managed through a computer support system.

Figure 4 900 node concept map for design of pilot's associate (after McNeese et al., 1990)
The concept maps of Figures 1 through 4 already involve more formal constraints than do diagrams in general. Novak and Gowin's methodology involves what are essentially syntactic constraints on the form of a concept map. Toulmin's methodology involves semantic constraints on what constitutes a legitimate argument form. However, neither methodology is sufficiently formal, nor intended to be so, that the map can be translated directly into a computational expression.
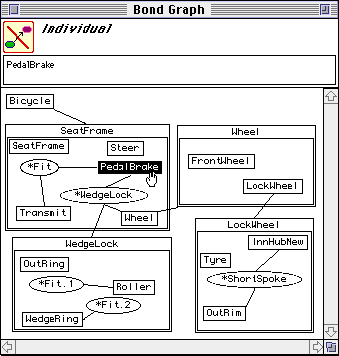
Many disciplines have developed diagramming techniques that constitute formal visual languages representing operational knowledge in diagrammatic form, for example, CPM and PERT charts (Moder and Phillips, 1970), Petri nets (Reisig, 1985), bond graphs (Karnopp and Rosenberg, 1975), and category-theoretic diagrammatic proofs (Mac Lane, 1971). For example, Figure 5 shows a bond graph for the components of a bicycle from an engineering design system (Gui and Mäntylä, 1993). Bond graphs are used in a wide range of engineering disciplines and have formal computational methodologies associated with their application (Karnopp, Rosenberg and van Dixhorn, 1989).

Figure 5 A bond graph in engineering design (after Gui and Mäntylä, 1993)
The philosopher and logician Charles Sanders Pierce developed his existential graphs as a formal reasoning technique for logical inference (Roberts, 1973), and in recent years there has been growing interest in formal status of visual proofs in mathematics (Barwise and Etchemendy, 1990; Shin, 1994). In artificial intelligence, Sowa (1984) has developed Peirce's graphs as formal conceptual structures for the representation of logical inference from natural language statements.
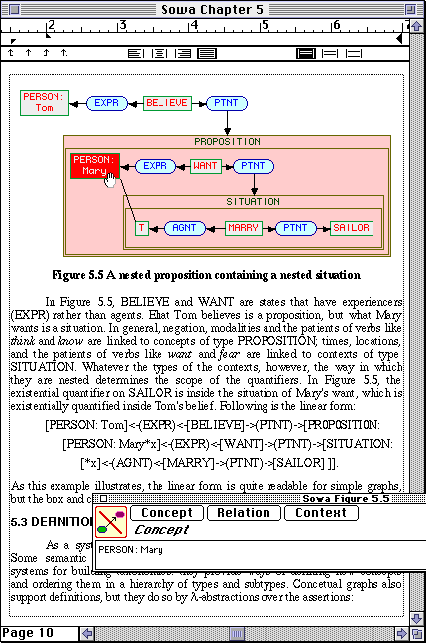
Figure 6 shows a conceptual graph from an article by Sowa (1991b) embedded as active hypermedia object within the article using an active document technology that allows the map to be edited within the document processor and interrogated by other programs as a formal knowledge base (Gaines and Shaw, 1993b). The graph represents the English language statement that "Tom believes that Mary wants to marry a sailor." It may be translated automatically into the linear, textual form of conceptual graphs as shown beneath it, and both diagram and textual form may be translated into predicate calculus. The textual form can also be loaded into the PEIRCE (Ellis and Levinson, 1992; Ellis, Levinson and Robinson, 1994) inference engine for conceptual graphs, and queried as a deductive database.

Figure 6 Concept map after a chapter by Sowa (1991b) embedded in an active document
The active document technology has been used to write "knowledge-based" papers (Gaines and Shaw, 1992a) in which concept maps representing formal knowledge structures are embedded in the document as active, editable entities having the user interface facilities of the same maps displayed in their own windows. To allow the document to print normally, the editing facilities at the top of the windows shown in the previous figures are normally hidden. They appear in a floating dialog box as shown near the bottom right of Figure 6 when the user double clicks in the concept map. The electronic version of the document is active, providing typographic text and page layout facilities, versioning, hypermedia sound and movies, hypertext links, and knowledge structures represented in a visual language. It can be read as a hypermedia document and also interrogated as a knowledge-based system for problem-solving. The paper version of the document is produced by printing the electronic version. It loses its active functionality but continues to act as a record of the knowledge in the document. Concept maps embedded in digital documents as active diagrams allow, for example, a conference proceedings to be issued as a computational document that makes the systems described in the proceedings operationally available.
gaines@cpsc.ucalgary.ca 22-Nov-95